Embedding charts into a PDF (HTML to PDF)

Introduction

Incorporating data visualization into your PDFs can greatly help your readers to understand your point. Especially when you are working with statistics and numbers.

APITemplate.io allows HTML to PDF conversion, and our PDF rendering engine also supports external Javascript libraries, CSS, and fonts for PDF creation.

There are a handful of Javascript chart libraries in the market such as ApexCharts.js, Chart.js, D3.js and etc that can be used to create HTML charts. The HTML charts created can be then embedded into your PDFs.

In this article, we are going to use an open-source Javascript library ApexCharts.js to create beautiful visualizations. ApexCharts.js renders charts into vector format, meaning that the rendered charts can be scaled to any size without sacrificing image quality in your generated PDFs.

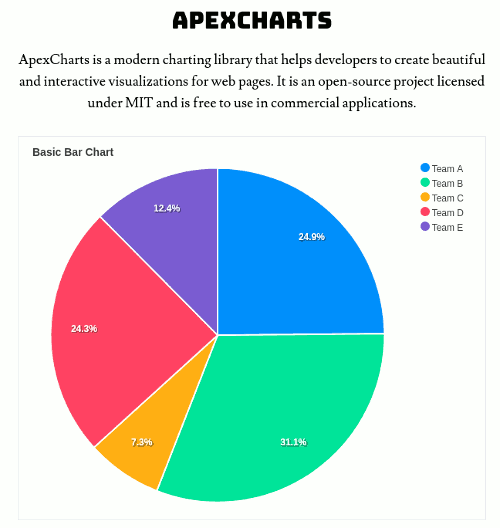
With ApexCharts.js you can embed popular chart types include line charts, donut charts, bar charts, pie charts, scatter plots, and other charts into your PDF documents.

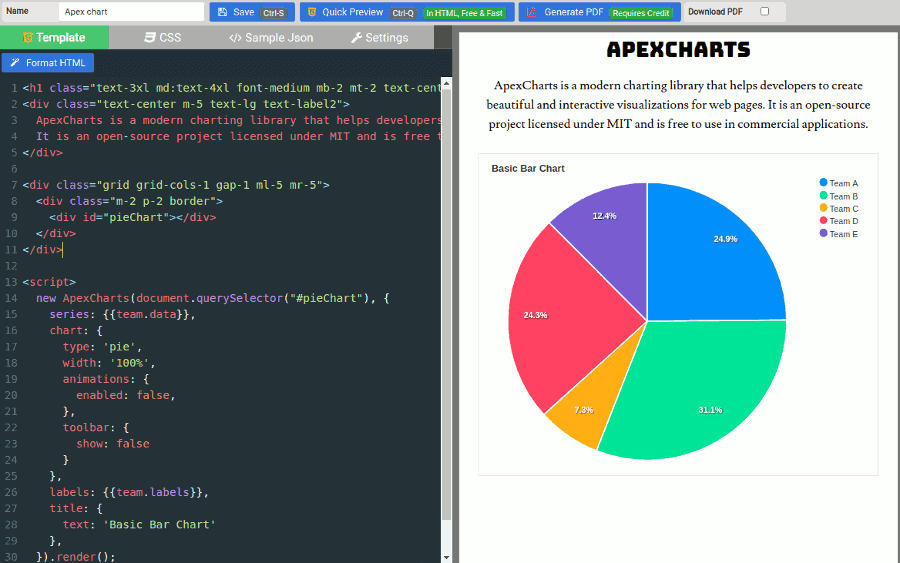
APITemplete.io’s HTML Editor

First, create a new HTML template in APITemplate.io Manage Templates console. There are 4 tabs in the HTML editor, namely Template, CSS, Sample JSON, and Settings. You can instantly preview the PDF in HTML format.

HTML Template

				
					<h1 class="text-3xl md:text-4xl font-medium mb-2 mt-2 text-center text-label">ApexCharts</h1>
<div class="text-center m-5 text-lg text-label2">
  ApexCharts is a modern charting library that helps developers to create beautiful and interactive visualizations for web pages.
  It is an open-source project licensed under MIT and is free to use in commercial applications.
</div>

<div class="grid grid-cols-2 gap-1 ml-5 mr-5">
  <div class="m-2 p-2 border">
    <div id="pieChart"></div>
  </div>
</div>

<script>
  new ApexCharts(document.querySelector("#pieChart"), {
    series: {{team.data|json}},
    chart: {
      type: 'pie',
      width: '100%',
      animations: {
        enabled: false,
      },
      toolbar: {
        show: false
      }
    },
    labels: {{team.labels|json}},
    title: {
      text: 'Basic Bar Chart'
    },
  }).render();

</script>


You can find more about ApexCharts’s Pie documentation here

The Sample JSON will be passed in the {{ variable }} tag, it’s a special syntax of Jinja2 to render variables in the HTML template. For example, {{team.data | json}}  is rendering the team data in JSON format.

You can learn more about the Jinja2 template language here

CSS

				
					<meta name="viewport" content="width=device-width, initial-scale=1">
<style>
  body {
    -webkit-font-smoothing: antialiased;
    background: white;
  }

  .text-label {
    font-family: "Bungee", sans-serif;
  }

  .text-label2 {
    font-family: "Lusitana", sans-serif;
  }
</style>
<link rel="stylesheet" href="https://fonts.googleapis.com/css?family=Bungee">
<link rel="stylesheet" href="https://fonts.googleapis.com/css?family=Lusitana">

<link href="https://cdnjs.cloudflare.com/ajax/libs/tailwindcss/2.0.3/tailwind.min.css" rel="stylesheet">
<script src="https://cdn.jsdelivr.net/npm/apexcharts"></script>


You can include the external resources such as fonts and Javascript libraries here.

Sample JSON

				
					{
  "team": {
    "data": [44,55,13,43,22],
    "labels": ["Team A","Team B","Team C","Team D","Team E"]
  } 
}


Sample data is the dynamic data to be used in the HTML template. 

Settings

Settings is the tab where you can update the paper size, orientation, footer and header.

Conclusion

Including charts into a PDF is easy with APITemplate.io and ApexCharts.js.

The next step is to automate the PDF generation either with nocode platforms such as Zapier, Integromat or you can make API calls to generate PDFs.

Table of Contents

Share:

Facebook
Twitter
Pinterest
LinkedIn

Articles for Image Generation

Articles for PDF Generation