Introduction
Infographics are powerful visual representation of information or data that gives us an easy to understand overview of a topic. It’s a very effective and valuable form of communication, because it not only keep the viewers up to date but also grab their attention.
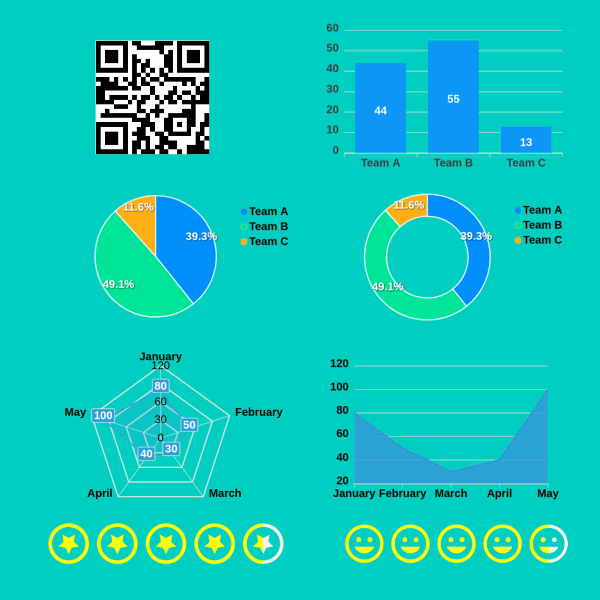
APITemplate.io now supports dynamic components such as QR code, barcode, rating, bar chart, pie chart, donut chart, radar chart and area chart. With APITemplate.io, it easy for you to embed charts and dynamic information into your images.
In this tutorial, we will cover the details of how to automate the stock chart creation with Polygon.io for stock data, Make.com for workflow and APITemplate.io for image creation.
Self-updating charts are huge time-savers. Once you setup the workflow, Make.com will pull the data from Polygon.io and the chart will automatically graph it. Then you can upload the generated images to social media or send them as newsletter to your usergroup.

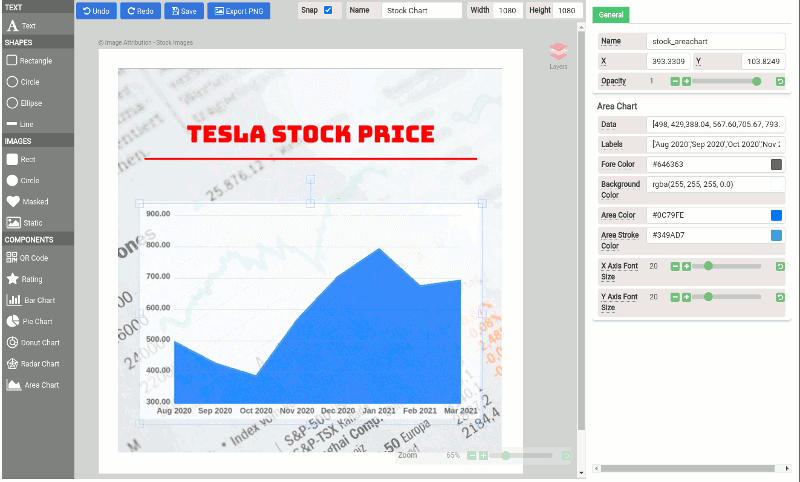
Step 1 – Create an APITemplate.io’s image template
Create two visual elements and name them accordingly
(i) Area Chart, and name it stock_areachart
(ii) Text, name it text_title for the stock name
and remember to save the template
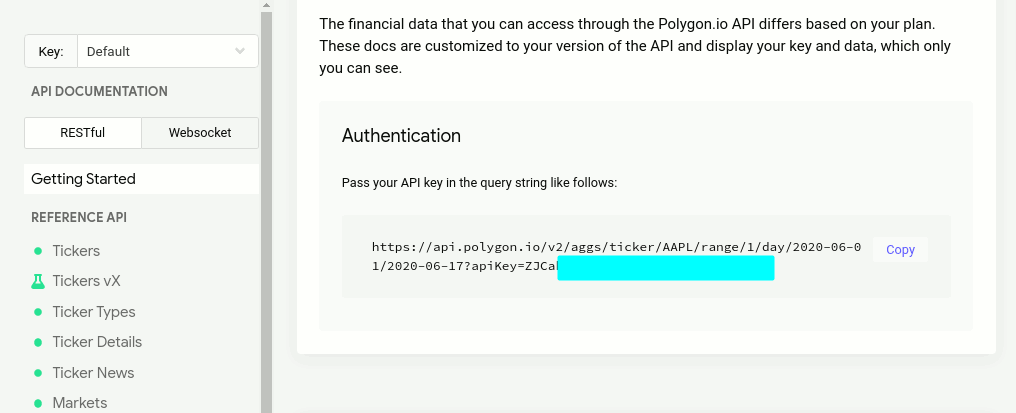
Step 2 – Create a Polygon.io account
Register and create an Polygon.io account, then head over to its REST API documentation to obtain API Key and URL
Step 3 – Automate the workflow on Make.com
The workflow overview as follows:
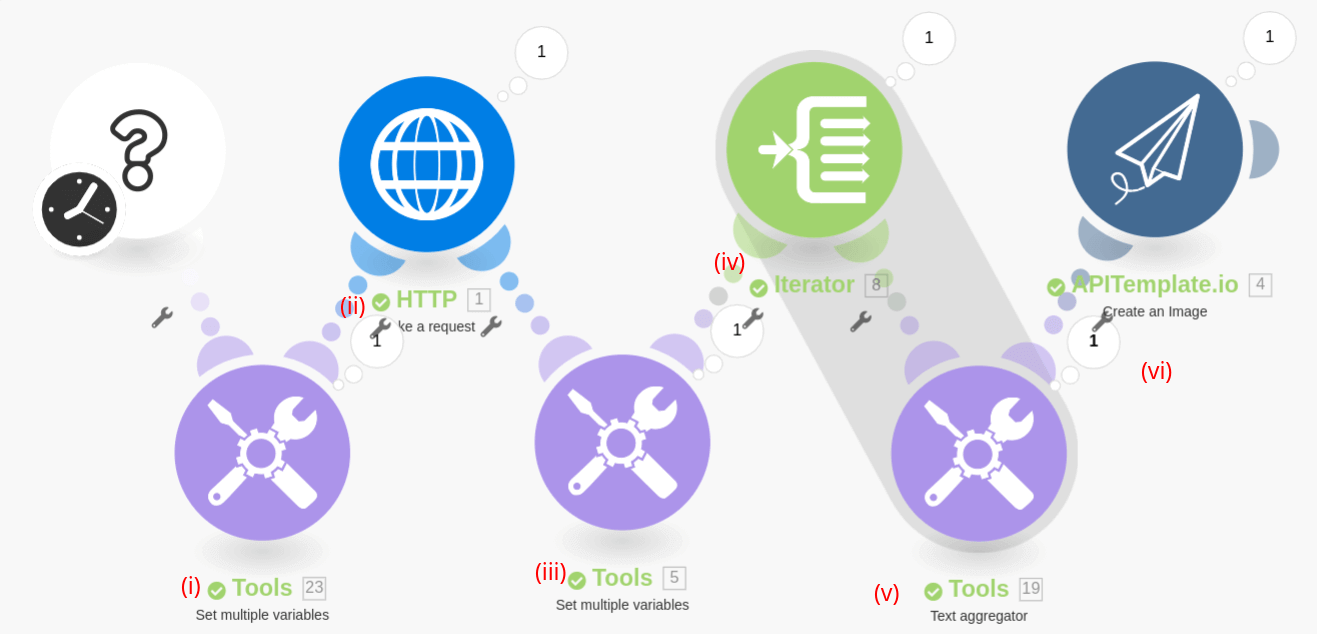
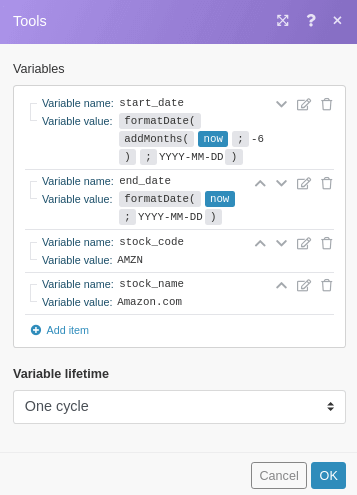
Step (i) Setup all the variables
start_date : 6 months from today
end_date : Today’s date
stock_code : Stock code, we are going to retrieve AMZN stock data
stock_name: Stock name, enter Amazon.con
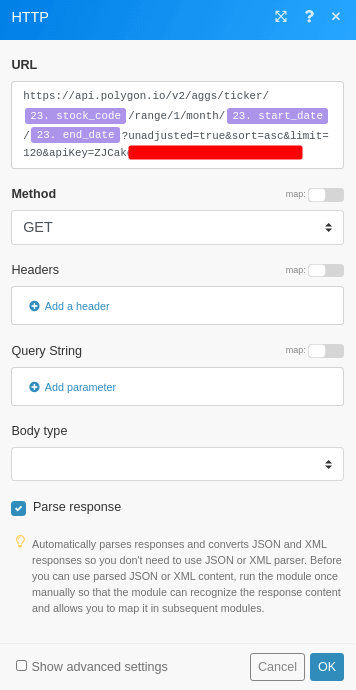
Step (ii) – Create a HTTP connection to Retrieve Stock Data
Make sure the URL is constructed as the format in the picture below.
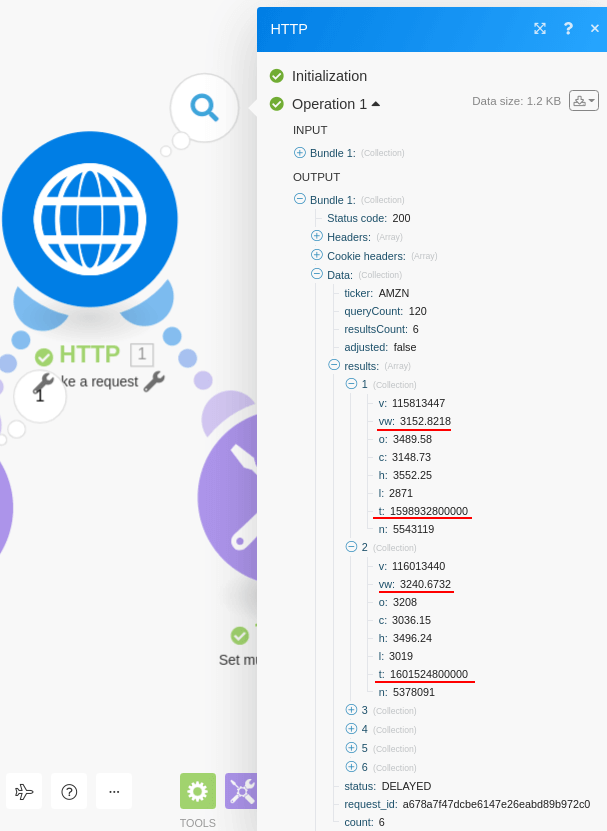
The output of step (ii) and we need to extract the following fields:
vw : The volume weighted average price.
t : The Unix Msec timestamp for the start of the aggregate window.
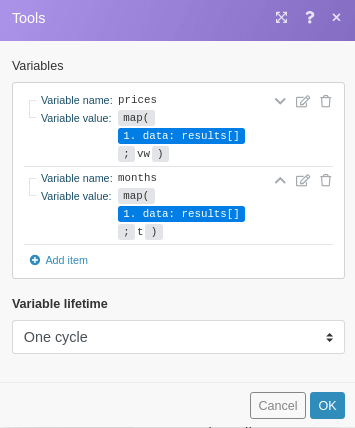
Step(iii) – Extract Price and Date Values from Polygon.io’s HTTP content
For the price and date values, we just use the map function to extract the values. However the date format is in UNIX timestamp, therefore we need to have additional steps to parse the dates in step (iv) & (v)
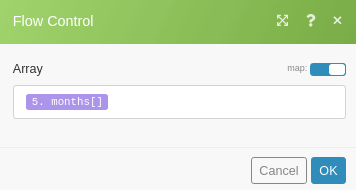
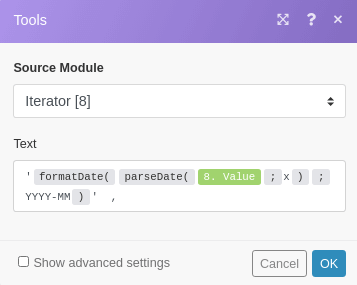
Step (iv) and Step (v) – Months Array Conversion
The date format is in nanosecond accuracy SIP Unix Timestamp, therefore we need to convert the dates. We will use an Iterator and Text Aggregator for the conversion.
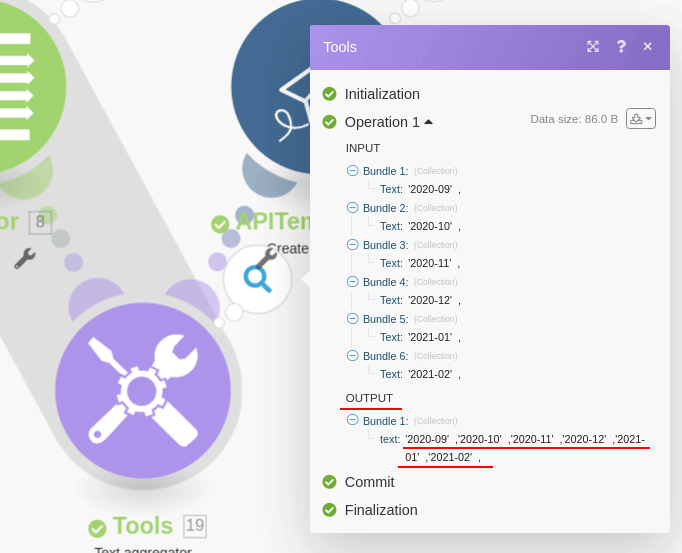
The output of step (v) as follows:
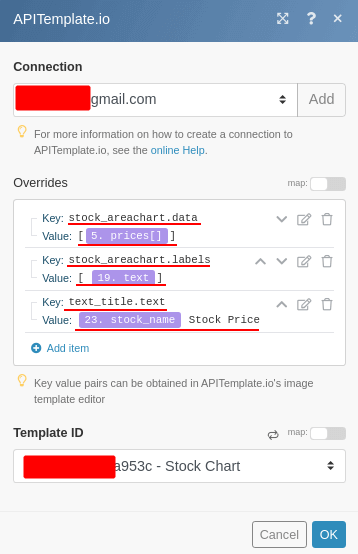
Step (vi) Generate an image with APITemplate.io
Create or select an APITemplate.io connection. Override the following values
(a) stock_areachart.data : prices of the stock, the values have to be enclosed in […]
(b) stock_areachart.labels : The X-Axis labels, the values have to be enclosed in […]
(c) text_titile.text : The title text
Finally the output image as follows:
Conclusion
In the first half of the tutorial, we walked you through the steps to create an image template and also touched on Polygon.io. In the second half, you learned how to create a workflow to automate stock chart image generation with Make.com.
The same workflow can be apply to other similar infographics such as integration with Google Analytics, stock index graphs and etc, you just follow the instructions in this tutorial you are all set to create beautiful inforgraphics.