Embedding Charts in PDFs
Incorporating data visualization into your PDFs helps readers quickly understand statistics and trends. APITemplate.io's PDF rendering engine supports external JavaScript libraries, CSS, and fonts — so you can use any client-side charting library to create rich, data-driven PDFs.
This guide is based on the blog post Embedding charts into a PDF (HTML to PDF) on the APITemplate.io blog.
Supported chart libraries
Any JavaScript charting library that renders in a browser will work. Popular choices include:
| Library | Rendering | License |
|---|---|---|
| ApexCharts.js | SVG (vector) | MIT |
| Chart.js | Canvas | MIT |
| D3.js | SVG | ISC |
Vector-based libraries like ApexCharts.js and D3.js produce SVG output that scales to any size without sacrificing quality — ideal for PDFs.
Walkthrough: Pie chart with ApexCharts.js
This example uses ApexCharts.js to embed a pie chart in a generated PDF.
1. Create an HTML template
In the Manage Templates console, create a new HTML template. The editor has four tabs — Template, CSS, Sample JSON, and Settings.
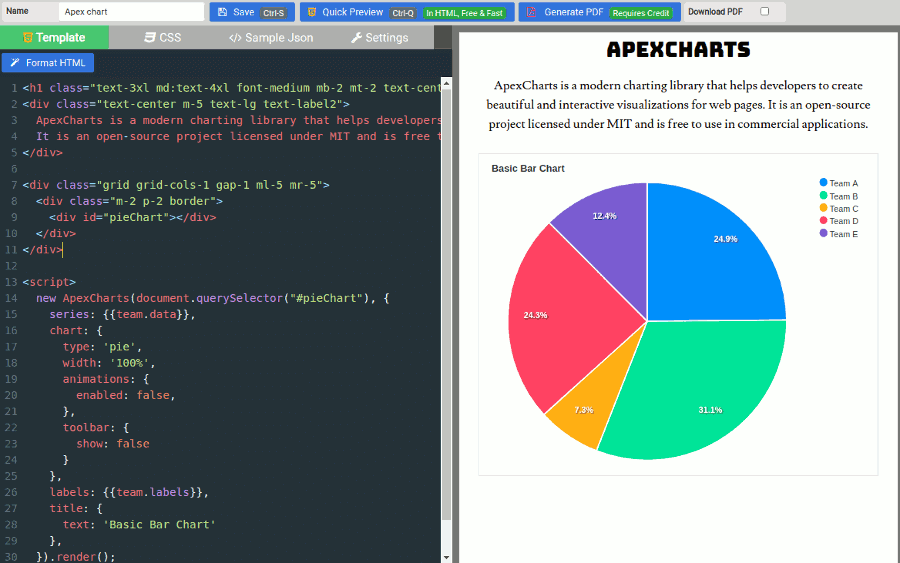
2. Template tab
Write your HTML and include the ApexCharts initialization script. Use Jinja2 {{ variable }} syntax to inject dynamic data at generation time.
<h1>ApexCharts</h1>
<p>
  ApexCharts is a modern charting library that helps developers to create
  beautiful and interactive visualizations for web pages. It is an
  open-source project licensed under MIT and is free to use in commercial
  applications.
</p>

<div id="pieChart"></div>

<script>
  new ApexCharts(document.querySelector("#pieChart"), {
    series: {{team.data|json}},
    chart: {
      type: "pie",
      width: "100%",
      animations: { enabled: false },
      toolbar: { show: false },
    },
    labels: {{team.labels|json}},
    title: { text: "Basic Pie Chart" },
  }).render();
</script>
{{team.data|json}} and {{team.labels|json}} use the Jinja2 json filter to output the data as valid JavaScript arrays. See the Template Language docs for more on Jinja2 syntax.
Disable chart animations (animations: { enabled: false }) — the PDF renderer captures a static snapshot, so animations won't be visible and can cause rendering issues.
3. CSS tab
Load the ApexCharts library and any external fonts in the CSS tab:
<script src="https://cdn.jsdelivr.net/npm/apexcharts"></script>

<link
  href="https://fonts.googleapis.com/css2?family=Bungee&family=Lusitana&display=swap"
  rel="stylesheet"
/>

<style>
  body {
    -webkit-font-smoothing: antialiased;
    background: white;
  }
  .text-label {
    font-family: "Bungee", sans-serif;
  }
  .text-label2 {
    font-family: "Lusitana", sans-serif;
  }
</style>
4. Sample JSON tab
Provide test data that the template will use for preview:
{
  "team": {
    "data": [44, 55, 13, 43, 22],
    "labels": ["Team A", "Team B", "Team C", "Team D", "Team E"]
  }
}
5. Settings tab
Configure the paper size, orientation, margins, and optional header/footer. See Headers and Footers for details.
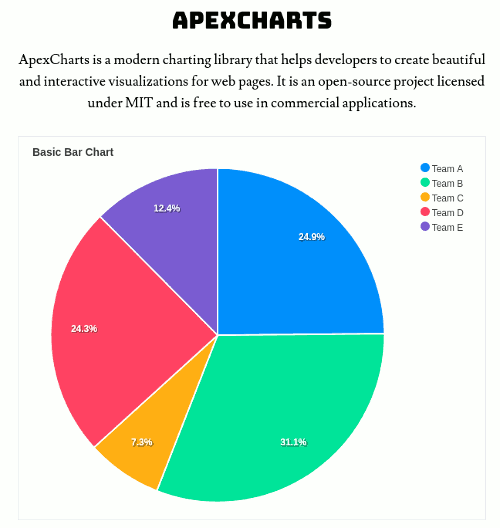
Result
After generating the PDF, you get a clean pie chart rendered directly in the document:
Other chart types
ApexCharts supports line, bar, area, donut, scatter, radar, and many more chart types. Swap out the type and series options to use a different visualization:
// Bar chart example
new ApexCharts(document.querySelector("#barChart"), {
  series: [{ name: "Revenue", data: [30, 40, 35, 50, 49, 60] }],
  chart: { type: "bar", animations: { enabled: false } },
  xaxis: { categories: ["Jan", "Feb", "Mar", "Apr", "May", "Jun"] },
}).render();
See the ApexCharts documentation for all available chart types and options.
Next steps
- Code/HTML Template Editor — learn the editor in depth
- Template Language (Jinja2) — dynamic data injection syntax
- Advanced PDF Topics — page breaks, backgrounds, and more
- Automate chart PDF generation with Zapier, Make, or the REST API
Originally published on the APITemplate.io blog.